
- Dataset
- Download CSV
Internet access in Washoe County, NV, by the numbers
Of 199,296 Washoe County households, 91.3 percent report an internet subscription, 7.4 percent report satellite and 5.6 percent, about 11,208 households, report none (U.S. Census Bureau, ACS 2020-2024 5-year, table B28002). The table below breaks that county figure into 13 places and 20 ZIP codes so you can see where the county average hides the edges.
- No contracts
- Local support
- 4.8 on Google (36 reviews)
- Since 2002
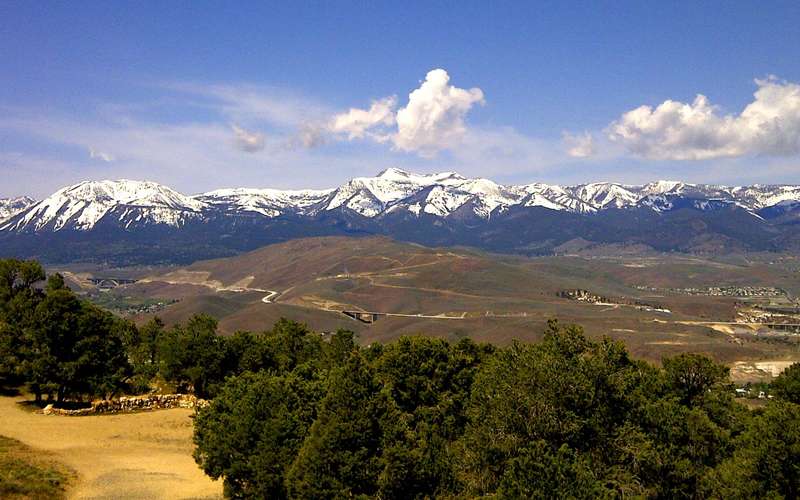
Washoe Valley from the Geiger Grade, Washoe County. Photo: TheConduqtor, CC BY-SA 3.0, via Wikimedia Commons, cropped. Photo credits
Washoe is the big county: Reno, Sparks and the north valleys hold most of the people, and the Census numbers for the city are close to the numbers for Nevada. The interesting rows are the smaller ones. A few ZIPs and valleys report satellite and phone-only service at three and four times the county rate.
Highlights
- Satellite: 7.4 percent of Washoe households, 14,719 of them, against 7.6 percent for Nevada (ACS 2020-2024, B28002).
- Highest satellite share by ZIP: 89510 (Palomino Valley) at 25.1 percent of 610 households, then 89508 (Cold Springs) at 14.4 percent.
- Highest no-subscription share by ZIP: 89442 (Wadsworth) at 17.3 percent and 89512 (Reno) at 15.2 percent, which is 1,736 households.
- Businesses: 14,199 establishments with 209,307 employees (U.S. Census Bureau, County Business Patterns 2023).
The data
How Washoe County gets online
U.S. Census Bureau, ACS 2020-2024 5-year, table B28002 (internet subscriptions), retrieved 2026-10-02. Households can report more than one type, so the shares do not add to 100. The ACS has no fixed-wireless line: those homes are counted under cable, fiber or DSL, or under other service. The thin mark on each bar is Nevada.
| Place | Households | Any subscription | Cable/fiber/DSL | Satellite | Phone data only | No internet | Work from home |
|---|---|---|---|---|---|---|---|
| Washoe County | 199,296 | 91.3% | 78.6% | 7.4% | 9.4% | 5.6% | 12.6% |
| Reno | 114,322 | 89.7% | 77.6% | 5.8% | 9.5% | 6.6% | 12.4% |
| Sparks | 42,414 | 93.1% | 81.2% | 8.6% | 8.6% | 4.2% | 11.1% |
| Sun Valley | 6,922 | 86.4% | 66.8% | 9.9% | 15.4% | 10.4% | 4.5% |
| Spanish Springs | 6,685 | 96.4% | 83.6% | 12.3% | 8.9% | 2.2% | 10.3% |
| Lemmon Valley | 1,875 | 94.2% | 83.3% | 13.7% | 3.8% | 5.8% | 5.6% |
| Golden Valley | 419 | n/a | about 82% | about 14% | about 13% | n/a | about 9% |
| Verdi | 527 | about 93% | about 77% | about 24% | about 0% | about 7% | about 13% |
| Mogul | 474 | n/a | about 92% | about 8% | about 3% | n/a | about 18% |
| Washoe Valley | 1,300 | 96.5% | 88.1% | 3.1% | 6.1% | 2.7% | 10.4% |
| Palomino Valley | 610 | about 87% | about 27% | about 25% | about 31% | about 8% | about 12% |
| Cold Springs | 3,618 | 94.7% | 80.6% | 6.3% | 12.2% | 4.1% | 10% |
| Wadsworth | 278 | about 74% | about 46% | about 6% | about 22% | about 20% | about 10% |
| Stead | 16,141 | 88% | 69.8% | 7.8% | 14.8% | 6.4% | 8.3% |
| ZIP 89431 | 15,472 | 87.5% | 72.8% | 8.7% | 10.6% | 8.5% | 8.7% |
| ZIP 89433 | 7,214 | 86.2% | 67% | 9.5% | 15.2% | 10% | 4.4% |
| ZIP 89434 | 10,973 | 94.2% | 84.6% | 8.1% | 6.7% | 3.2% | 8.4% |
| ZIP 89436 | 18,692 | 97.8% | 86.5% | 10.1% | 8.2% | 0.9% | 14.6% |
| ZIP 89439 | 1,190 | 88.2% | 65.6% | 10.6% | 10.3% | 9% | 11% |
| ZIP 89441 | 5,335 | 95.3% | 83% | 11.5% | 8.2% | 3% | 10.6% |
| ZIP 89442 | 318 | 77.7% | 50.6% | 6.3% | 20.8% | 17.3% | 11.8% |
| ZIP 89501 | 2,331 | 80.1% | 63.1% | 4.8% | 11.7% | 7.6% | 14.7% |
| ZIP 89502 | 19,348 | 86.7% | 73.6% | 6.9% | 9.9% | 9.9% | 8.1% |
| ZIP 89503 | 13,195 | 89.9% | 78.5% | 3.8% | 10.1% | 5.9% | 11.9% |
| ZIP 89506 | 16,141 | 88% | 69.8% | 7.8% | 14.8% | 6.4% | 8.3% |
| ZIP 89508 | 5,114 | 94.7% | 72.4% | 14.4% | 12.6% | 4% | 11.2% |
| ZIP 89509 | 16,788 | 89.6% | 78.9% | 5.2% | 7.9% | 7% | 18.1% |
| ZIP 89510 | 610 | 86.7% | 26.9% | 25.1% | 30.7% | 7.5% | 11.8% |
| ZIP 89511 | 13,054 | 95.7% | 85.1% | 6.4% | 7.7% | 2% | 21% |
| ZIP 89512 | 11,442 | 80.2% | 65.6% | 5.7% | 12.2% | 15.2% | 3.7% |
| ZIP 89519 | 3,883 | 97.3% | 88.6% | 8.5% | 6.9% | 1.6% | 18.6% |
| ZIP 89521 | 16,848 | 96.8% | 87.5% | 6.9% | 6.1% | 1.9% | 20.1% |
| ZIP 89523 | 16,342 | 95.4% | 85.1% | 6.1% | 6.4% | 3.1% | 12.3% |
| ZIP 89704 | 1,844 | 96.8% | 84.4% | 11.9% | 4.6% | 2.3% | 12.1% |
| Nevada | 1,202,593 | 92.2% | 76.6% | 7.6% | 11.8% | 5.3% | 11.9% |
| United States | 129,227,496 | 91.1% | 75.6% | 6.6% | 11.5% | 6.5% | 15.1% |
U.S. Census Bureau, ACS 2020-2024 5-year, table B28002 (internet subscriptions), retrieved 2026-10-02. Small places (under about 2,000 people) are rounded and read as about; a 0% or 100% there is a sampling artifact and is not printed. Households can report more than one type.
Satellite share by place, ranked
Ranked among places with reliable estimates only.
How does Washoe County compare with Nevada?
The county is close to the state on every line. Washoe reports 78.6 percent of households on a cable, fiber or DSL subscription against 76.6 percent for Nevada, 9.4 percent on a phone data plan only against 11.8 percent, 7.4 percent on satellite against 7.6 percent, and 5.6 percent with no subscription against 5.3 percent (U.S. Census Bureau, ACS 2020-2024 5-year, table B28002). The county work-from-home share is 12.6 percent of 248,976 workers, and the mean commute is 22.5 minutes.
Which Washoe places rely most on satellite or phone data?
Among places with reliable estimates, Lemmon Valley reports 13.7 percent satellite, Spanish Springs 12.3 percent and Sun Valley 9.9 percent. The small places run higher: Palomino Valley, with about 1,457 residents, reports about 25 percent satellite and about 31 percent on a phone plan only, and Verdi reports about 24 percent satellite (ACS 2020-2024, B28002). Small places carry wide margins of error, so we do not rank them against each other.
By ZIP, 89510, 89508, 89704, 89441 and 89439 all sit above 10 percent satellite. Those ZIPs are mostly the valley and foothill communities around the urban core. The matching pages are 89510 and 89508.
Where do the most households have no subscription?
In share, 89442 (Wadsworth) is first at 17.3 percent, but it holds only about 318 households. In headcount the largest groups are in Reno and Sparks ZIPs: 89502 with 1,915 households, 89512 with 1,736, 89431 with 1,311, 89509 with 1,177 and 89506 with 1,034 (ACS 2020-2024, B28002). The ACS counts households with no subscription of any kind, whether or not a provider could reach them, and it does not say why. The homes without internet page ranks all 35 ZIPs.
What does Washoe work from home look like?
ZIP 89511 reports 21.0 percent of workers working from home, 89521 reports 20.1 percent, 89519 reports 18.6 percent and 89509 reports 18.1 percent, against 3.7 percent in 89512 and 4.4 percent in 89433 (ACS 2020-2024, B08301). The spread is wide enough that two Reno households on the same plan can need quite different upload speeds. See the work-from-home page for every county.
What is planned in Washoe County?
Nevada's provisional High Speed NV plan lists 17 projects in Washoe County, about 27.4 million dollars in all, led by a Hot Spot Broadband project at Spanish Springs (estimated end January 2027) and Rural Telephone Company at Lemmon Valley (estimated end December 2029). Other subgrantees named for Washoe include Reno-Sparks Indian Colony, NV Bell Telephone, DTS Fiber, Amazon Kuiper and SpaceX (Nevada OSIT BEAD Final Proposal data, read 10/15/26). NTIA approved the revised Nevada plan on January 8, 2026, and every project is provisional and subject to change. High Desert is not a subgrantee. See the Washoe County BEAD page.
What does this mean for a tower-based option?
A fixed wireless link depends on a clear path from a tower to the building. The county numbers tell you where people have already looked past a wire, not where a tower reaches. Send the address through the address check and a person looks at the path from the nearest tower, then calls you back.
What does the FCC's December 2025 data add for Washoe County?
For Washoe County, the FCC Broadband Data Collection replaces the 2021 Form 477 snapshot with location-level filings. As of December 31, 2025 (files read October 16, 2026), the county has 161,538 broadband serviceable locations. The largest land-based rows: Spectrum, cable, 154,009 locations (top tier up to 1,000 Mbps down); Hot Spot Broadband, unlicensed fixed wireless, 138,954 locations (top tier up to 100 Mbps down); T-Mobile, licensed fixed wireless, 129,517 locations (top tier up to 100 Mbps down); Net NV, unlicensed fixed wireless, 126,226 locations (top tier up to 1,000 Mbps down); Verizon, licensed fixed wireless, 91,108 locations (top tier up to 300 Mbps down); AT&T, copper (DSL), 87,460 locations (top tier up to 100 Mbps down).
Read as one county, the newest filings put a wired 100/20 tier at 158,376 of 161,538 locations in Washoe County and a fixed wireless 100/20 tier at 154,174, from 13 fixed wireless filers. The overlap is large; the 2,860 locations where a fixed wireless filing stood alone at that level are where a tower link fills a gap on the FCC's own map; separately, 170 had no land-based filing at 25/3 or better, leaving satellite as the only reported option. The FCC counts broadband serviceable locations in Washoe County, which are buildings, not households or customers, and each row is the provider's own report.
How do income and age shape the Washoe County numbers?
Two newer Census tables add who is behind the Washoe County subscription numbers. There, 76.2 percent of households earning under $35,000 a year report broadband, against 96.6 percent of those at $75,000 or more (table B28004; Nevada 81.5 percent and 96.6 percent). Among residents 65 and over, 88.2 percent live in a home with broadband and 5.8 percent live in a home with no computer (table B28005; Nevada 88.1 percent and 5.7 percent). Housing built in 2010 or later is 15.5 percent of units, and housing from before 1990 48.9 percent (table B25034). All Washoe County figures are from the Census Bureau, ACS 2020-2024 5-year, pulled October 16, 2026.
Method
Figures are from the U.S. Census Bureau, American Community Survey 2020-2024 5-year estimates (tables B28002, B28001, B08301, B25024, B01001 and B19013), retrieved 2026-10-02, and from County and ZIP Code Business Patterns 2023. They are survey estimates with margins of error. Places under about 2,000 people are rounded to whole percents and read as about; a 0 or 100 percent for a tiny place is left out as a sampling artifact. The ACS has no fixed wireless line, so a household on a tower link is counted under cable, fiber or DSL or under other service. The ACS asks about subscriptions, not about whether a provider could serve the address.
Sources
- api.census.gov/data/2024/acs/acs5 (ACS 2020-2024 5-year, Washoe County, places and ZCTAs, B28002/B08301, retrieved 2026-10-02)
- api.census.gov/data/2023/cbp (U.S. Census Bureau, County Business Patterns 2023, retrieved 2026-10-02)
- osit.nv.gov/broadband/bead/ (Nevada OSIT BEAD Final Proposal data, fp_deployment_projects.csv, read 10/15/26)
- gov.nv.gov/press-releases/governor-lombardo-announces-federal-approval-of-nevadas-bead-pla (Governor's release, January 8, 2026)
- broadbandmap.fcc.gov/data-download/nationwide-data (FCC Broadband Data Collection, fixed broadband availability as of December 31, 2025, Nevada files dated October 13, 2026, read 2026-10-16)
- api.census.gov/data/2024/acs/acs5 (U.S. Census Bureau, ACS 2020-2024 5-year, tables B19013, B25034, B08301, B28004, B28005, pulled 2026-10-16)
Talk to a person
- Call 775-575-9593 775-391-5660 Open 9-5 every day
- Email info@hdiss.net
Related
Local since 2002
Fixed wireless from towers in Northern Nevada. Three plans, no contracts, local support, 4.8 on Google from 36 reviews.
About High DesertOSIT BEAD data
Planned build-outs
High Speed NV (BEAD) projects in Washoe County: the provisional state list for this county.
Does a high satellite share mean High Desert covers that ZIP?
No. It shows that households there use satellite today. Whether a tower reaches your building is decided by the address check.
Why do some ZIPs show more households than the town beside them?
ZIP codes follow mail routes, not town lines. A ZIP can take in part of Sparks and part of Spanish Springs at once.
Can I download the table?
Yes. The CSV link at the top of the page gives every row in the table.
Are these numbers current?
They are the 2020-2024 five-year estimates, the newest set the Census had published when we retrieved them on October 2, 2026.
Open 9-5 every day
Can we reach your roof?
Send the address. A person looks at the path from our nearest tower and calls you back: clear, not clear, or we need to look at it from your roof.
- No contracts
- Local support
- 4.8 on Google (36 reviews)
- Since 2002
High Desert Internet Services, PO Box 11353, Reno NV 89510. info@hdiss.net